CORRECTION: Although my mistake is beyond the scope of the Step 1 exam, the interpretation of Confidence Interval that I used in the video is incorrect & a bit oversimplified. I stated that for an individual study there is a 95% chance that the true value lies within the 95% CI. However, confidence interval is a type of frequentist inference and the interpretation I gave in the video is really better suited for interpreting statistics of Bayesian Inference (Again please don’t feel like you need to know these terms for the exam). What I should have said is something like “if 100 similarly designed studies use a 95% confidence interval then 95 of these intervals will contain the true value and 5 will not. For more info on this misconception click here
https://en.wikipedia.org/wiki/Bayesian_inferenceA Confidence Interval (CI) is the range of values the true value in the population is expected to fall within based on the study results. The results we receive in any study do not perfectly mirror the overall population and the confidence interval lets us get a better idea of what the results in the overall population might be. The confidence interval is based on a certain level of confidence. Don't get this confused with the value of the sample population. If the measured BMI in 100 people in your study population and the mean is 25 than you are very confident that the actual mean BMI in that group is 25. Confidence interval only comes into play when you try to extrapolate your study results to other situations (like to the population overall).
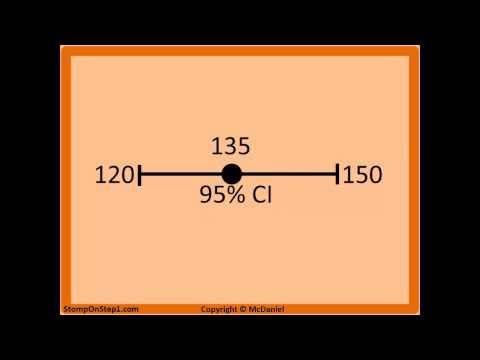
If you have a 95% confidence interval (which is most common) that means there is a 95% chance that the true value lies somewhere in the confidence interval. You can also alter the width of the confidence interval by selecting a different percentage of confidence. 90% & 99% are also commonly used. A 99% confidence interval is wider (has more values) than a 95% confidence interval & 90% confidence interval is the most narrow.
The width of the CI changes with changes in sample size. The width of the confidence interval is larger with small sample sizes. You don't have enough data to get a clear picture of what is going on so your range of possible values is wider. Imagine your study on a group of 10 individuals shows an average shoe size of 9. If based on the results you are 95% sure that the actual average shoe size for the entire population is somewhere in between 6 and 12, then the 95% CI is 6-12. Based just on your results you don't really know what the average in the population is, because your study population is a very small sliver of the overall population. Now if you repeat the study with 10,000 individuals and you get an average shoe size of 9 the confidence interval is going to be smaller (something like 8.8 to 9.3). Here you have a much larger sample size and therefore your results give you a much clearer idea of what is going on with the entire population. Therefore, your 95% CI shrinks. The width of the confidence interval decreases with an increasing sample size (n). This is sort of like the standard deviation decreasing with an increased sample size.
Confidence intervals are often applied to RR & OR. For example, the odds ratio might be 1.2, but you aren't sure how much of an impact chance had on determining that value. Therefore, instead of just reporting the value of 1.2 you also report a range of values where the true value in the population is likely to lie. So we would report something like the odds ratio is 1.2 and we are 95% confident that the true value within the overall population is somewhere between .9 and 1.5.
You can use the confidence interval to determine statistical significance similar to how you use the p-Value. If the 95% confidence interval crosses the line of no difference that is the same things as saying there is a p-value of greater than 5%. This is intuitive because if the confidence interval includes the value of no difference then there is a reasonable chance that there is no difference between the groups. If the confidence interval does not cross the line of no difference than the observed difference is statistically significant, because you know it is highly unlikely that the two groups are the same.
For both relative risk (RR) and odds ratio (OR), the "line of no difference" is 1. So an RR or OR of 1 means there is no difference between the two groups being compared with respect to what you are measuring. This is because RR and OR are ratios and a value divided by itself is 1. If the 95% confidence interval of the RR or OR includes the value 1, that means it is possible the true value is 1 and there is no difference between groups. If that is the case, we say the null hypothesis cannot be rejected or that there is no statistically significant difference shown. This is the same thing as saying the p-value is greater than .05.
About the Site 🌐
This site provides links to random videos hosted at YouTube, with the emphasis on random. 🎥
Origins of the Idea 🌱
The original idea for this site stemmed from the need to benchmark the popularity of a video against the general population of YouTube videos. 🧠
Challenges Faced 🤔
Obtaining a large sample of videos was crucial for accurate ranking, but YouTube lacks a direct method to gather random video IDs.
Even searching for random strings on YouTube doesn't yield truly random results, complicating the process further. 🔍
Creating Truly Random Links 🛠️
The YouTube API offers additional functions enabling the discovery of more random videos. Through inventive techniques and a touch of space-time manipulation, we've achieved a process yielding nearly 100% random links to YouTube videos.
About YouTube 📺
YouTube, an American video-sharing website based in San Bruno, California, offers a diverse range of user-generated and corporate media content. 🌟
Content and Users 🎵
Users can upload, view, rate, share, and comment on videos, with content spanning video clips, music videos, live streams, and more.
While most content is uploaded by individuals, media corporations like CBS and the BBC also contribute. Unregistered users can watch videos, while registered users enjoy additional privileges such as uploading unlimited videos and adding comments.
Monetization and Impact 🤑
YouTube and creators earn revenue through Google AdSense, with most videos free to view. Premium channels and subscription services like YouTube Music and YouTube Premium offer ad-free streaming.
As of February 2017, over 400 hours of content were uploaded to YouTube every minute, with the site ranking as the second-most popular globally. By May 2019, this figure exceeded 500 hours per minute. 📈
List of ours generators⚡
Random YouTube Videos Generator
Random Film and Animation Video Generator
Random Autos and Vehicles Video Generator
Random Music Video Generator
Random Pets and Animals Video Generator
Random Sports Video Generator
Random Travel and Events Video Generator
Random Gaming Video Generator
Random People and Blogs Video Generator
Random Comedy Video Generator
Random Entertainment Video Generator
Random News and Politics Video Generator
Random Howto and Style Video Generator
Random Education Video Generator
Random Science and Technology Video Generator
Random Nonprofits and Activism Video Generator